


 10 / 17

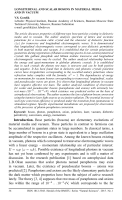
Fig. 7. Diagrams of experimental installations for the analysis of the induced Raman
scattering in condensed media:
a
— induced Raman scattering by molecular modes (
1
— laser;
2
— lenses;
3
—
semitransparent plate;
4
— analysed sample;
5
— light filter;
6
— holder;
7
— light guide
probe;
8
— minispectrometer;
9
— computer;
10
— power sensor;
b
— induced globular
scattering in photon crystals (
1
— laser;
2
,
5
,
7
— semitransparent plates;
4
— light filter;
6
— lens;
3
,
8
,
11
— power sensor;
9
— analysed sample;
10
— interferometer;
12
— detector)
a process is allowed both in the centrosymmetrical and non-centrosymmet-
rical media and meets the conservation laws (9).
Fig. 10 shows spectra of the induced Raman scattering by transverse
and longitudinal modes of a ferroelectric lithium niobate crystal placed into
the ruby laser resonator generating giant pulses with a high peak intensity
(
≈
100
mW/cm
2
). In one case, the polar axis of the crystal was directed
along the laser ray (Fig. 10,
a
), in another case, it was perpendicular to the
ISSN 1812-3368. Herald of the BMSTU. Series “Natural Sciences”. 2015. No. 1
45